Navigating the Web: Prioritizing Supply Chain Risk with Neo4j
Group capstone: modeling automotive BOM dependencies in Neo4j and using PageRank and Leiden community detection to surface chokepoints and modular risk—plus demo video and full submission.
Peter Mangoro
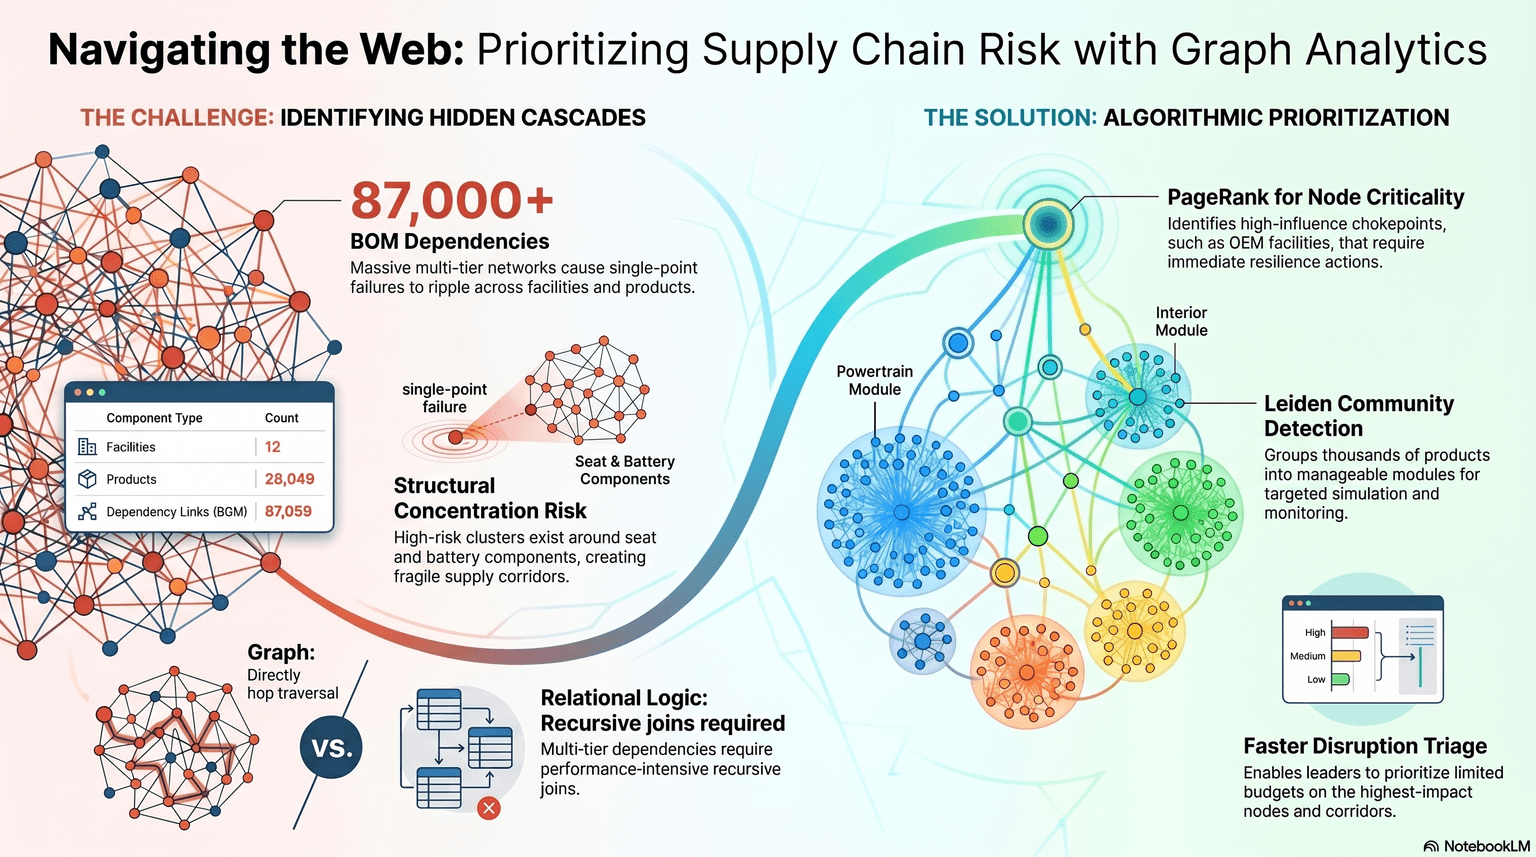
Modern automotive supply chains are less like a line and more like a web: one weak link can cascade through tiers of bill-of-materials (BOM) relationships. At capstone scale—tens of thousands of products and 87,000+ BOM dependency edges—relational “recursive join” thinking starts to fight you. Graphs match the problem shape: hop directly along dependencies instead of repeatedly stitching tables.
Team context
This capstone was completed as a group. Team members were:
- Bekithemba Nkomo
- Peter Mangoro
- Masheia Dzimba
What we set out to do
Build a Neo4j-backed analytics story that:
- Makes multi-tier BOM risk visible (concentration, fragile corridors, single-point pressure).
- Uses graph algorithms to prioritize where to act first when time and budget are finite.
- Contrasts graph traversal with the performance and mental overhead of deep recursive joins in relational designs.
How the graph helps
- PageRank (node criticality) highlights high-influence chokepoints—often OEM-adjacent facilities or hubs that sit on many dependency paths—so resilience work targets nodes that actually move the needle.
- Leiden community detection collapses thousands of SKUs into coherent modules (for example powertrain vs. interior groupings in the narrative visualization), which is useful for monitoring, simulation scoping, and communication with non-graph stakeholders.
Together, these outputs support faster disruption triage: a ranked view of what matters most instead of treating every edge as equally urgent.
Demo walkthrough
Open on YouTube if the player does not load.
Artifacts
- Code and notebooks: GitHub —
finalProject - Written submission (PDF): Automotive Supply Chain — group written submission (PDF)
What I learned
Graph analytics shines when the question is inherently path- and neighborhood-shaped—supply risk, propagation, and “what breaks if this node fails?” are exactly that. On our team, the hard part was not only running algorithms, but curating the projection: which relationships matter as undirected risk vs. directed flow, and how communities align with real operational units.
If you are exploring similar work, start from a crisp definition of BOM semantics (multiplicity, direction, and what an edge means), then let PageRank and community detection stress-test whether your graph tells the same story the business tells.
Analyzing a Healthcare Knowledge Graph with Cypher and Graph Data Science
How I explored a FAERS-style healthcare graph, moved from Cypher EDA to GDS workflows, and turned graph results into practical analytical insights.
My First AWS Adventure: Building a Sentiment Analysis System on a Budget
From zero to production-ready: How I built a full-stack sentiment analysis platform entirely within AWS Free Tier, exploring serverless architecture, cost optimization, and creative problem-solving along the way.