Peter MangoroData Analyst | BI Analyst
Work Experience
Healthcare BI, SQL-backed reporting, and production data systems.
Software & Data Engineer at NCRI
- Design, build, and maintain dashboards, data pipelines, and reporting frameworks for stakeholders.
- Analyze energy, financial, operational, and research datasets to produce decision-useful insights.
- Develop and maintain data models, KPIs, and forecasting support for consulting engagements.
- Support research publications and managed-entity reporting with documented analytics.
- Apply data-quality checks, documentation, and appropriate privacy and security practices.
Environment: SQL, Python, dashboards, reporting automation, KPI modeling, data quality.
Business Data Analyst & BI Developer at UMP Healthcare
- Gathered reporting requirements from clinical and operational teams and translated them into dashboard and KPI specs.
- Developed Power BI dashboards to monitor healthcare performance metrics for non-technical stakeholders.
- Wrote SQL queries to analyze patient, financial, and operational data.
- Built data models and automated recurring reports, reducing manual spreadsheet effort.
- Performed data validation and documented BI reporting standards.
Environment: Power BI, SQL, healthcare data analytics, reporting automation, data validation.
Software Engineer at Propertybook
- Designed PostgreSQL data models and reporting views for listings, leads, and operational activity.
- Built ETL-style ingestion and transformation workflows so listing and lead data could be queried consistently.
- Automated reporting pipelines that replaced ad-hoc exports for business stakeholders.
- Supported more reliable lead reporting (~20% improvement in lead conversion attributed to cleaner operational data).
Environment: PostgreSQL, SQL, Laravel, ETL-style reporting pipelines, operational dashboards.
Software and Data Engineer at SoliderMed
- Designed database schemas and reporting-ready data models for patient and operational systems.
- Built ETL/ELT-style pipelines from application databases into reproducible operational reports.
- Replaced ad-hoc spreadsheets with SQL-backed reporting and reconciliation (~30% less manual processing).
- Documented data workflows and handled sensitive data with healthcare-conscious privacy practices.
Environment: Django, Laravel, SQL, healthcare operational data, reporting automation, data quality.
Software Engineer at DataConexions
- Built and maintained SQL-backed applications, APIs, and data access layers for platforms used by 10,000+ users.
- Owned schema design, reporting-related queries, production support, and technical documentation.
- Partnered with stakeholders to deliver reliable data workflows under changing priorities.
Environment: SQL, APIs, relational schemas, Git, production support.
Skills
Evidence-backed tools for Data Analyst and BI work—not self-rated percentages.
Analyst Core
SQL, Power BI, and Tableau used in UMP healthcare reporting and graduate analytics work.
Data Engineering
PostgreSQL production schemas, AWS S3/Glue/Lambda/Athena pipelines, and reporting automation.
Modeling
KPI definition, reporting models, and interpretable ML with locked holdout evaluation.
Delivery
Stakeholder dashboards and documented reporting for clinical, operations, and product teams.
Featured projects
SQL, dashboards, and cloud analytics — one clear result per project.

Traffic Violation Data Analysis
2.8M+ traffic records turned into Tableau & Streamlit KPIs for non-technical stakeholders
Analyzed 2.8M+ public traffic enforcement records to surface trends, patterns, and KPIs for non-technical stakeholders. Built Python ETL, Tableau, and Streamlit dashboards for safety and enforcement insights.

AWS Serverless ETL Pipeline
Serverless ETL (S3 → Glue → Athena → dashboards) at ~$1–2/month with Parquet cost savings
End-to-end serverless ETL for e-commerce sales data—from ingest to SQL analytics and dashboards—at ~$1–2/month. S3 + Lambda + Glue into Parquet, Athena SQL, QuickSight/interactive dashboards, with data-quality checks.
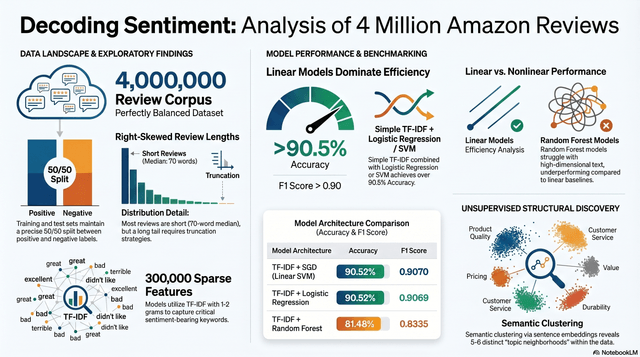
Amazon Review Sentiment at Scale
Group capstone: 4M-row corpus, 400k locked test — TF–IDF linear model F1 ~0.906, ROC-AUC ~0.966
Group capstone on binary sentiment over a 4M Amazon Reviews corpus (3.6M train / 400k locked test). Compared linear models, Random Forest, MLP, and DistilBERT under strict leakage controls—TF–IDF + linear baseline reached F1 ~0.906 / ROC-AUC ~0.966.

Hospital Readmission Prediction Model
30-day readmission models on encounters from 130 hospitals + Shiny dashboard (coursework, not deployed in clinics)
Interpretable ML to predict 30-day hospital readmissions using patient encounters drawn from 130 U.S. hospitals—logistic regression, CART, and Random Forest—with an R Shiny dashboard for analytics stakeholders. Coursework model, not a clinical deployment.
Education
Degrees and coursework that support analyst and BI work.
M.S., Data Analytics and Visualization
Yeshiva University · New York, NY
Coursework — Machine Learning, Statistics, Data Visualization, SQL/Data Management, Cloud Computing, Graph Data Science
B.Eng., Telecommunications Engineering
National University of Science and Technology (NUST) · Zimbabwe
Certifications
Credentials aligned with data analysis and graph analytics.
- Google Data Analytics — Ask Questions to Make Data-Driven Decisions (Jan 2025)
- Google Data Analytics — Foundations: Data, Data, Everywhere (Jan 2025)
- Neo4j Certified Professional (2026)
- Neo4j Graph Data Science Certification (2026)
Let's talk roles
Open to full-time Data Analyst and BI Analyst roles in NYC or remote. Email is the fastest path; a short intro call is optional.
Prefer a quick intro call?
Book 15–20 minutes to talk about Data Analyst / BI Analyst roles and how I can help your team.